In September 2003, Typhoon Maemi slammed into the Korean Peninsula. On Jeju Island it recorded an instantaneous wind speed of 216 km/h, and in the Haeun-dong district of Masan a 4.39 m storm surge rushed in and swallowed an underground shopping arcade. 119 dead; property damage of about 4.78 trillion won (National Archives of Korea tally). No one denies that a typhoon is a “disaster.”
And yet that very same typhoon, seen through the eyes of physics, is an entirely different thing. It is a giant heat engine that takes in the heat energy of the warm sea surface and turns it into the work we call wind. It is not “a heat engine instead of a disaster.” It is a disaster and a heat engine at the same time. A typhoon has two faces, and both faces are real.
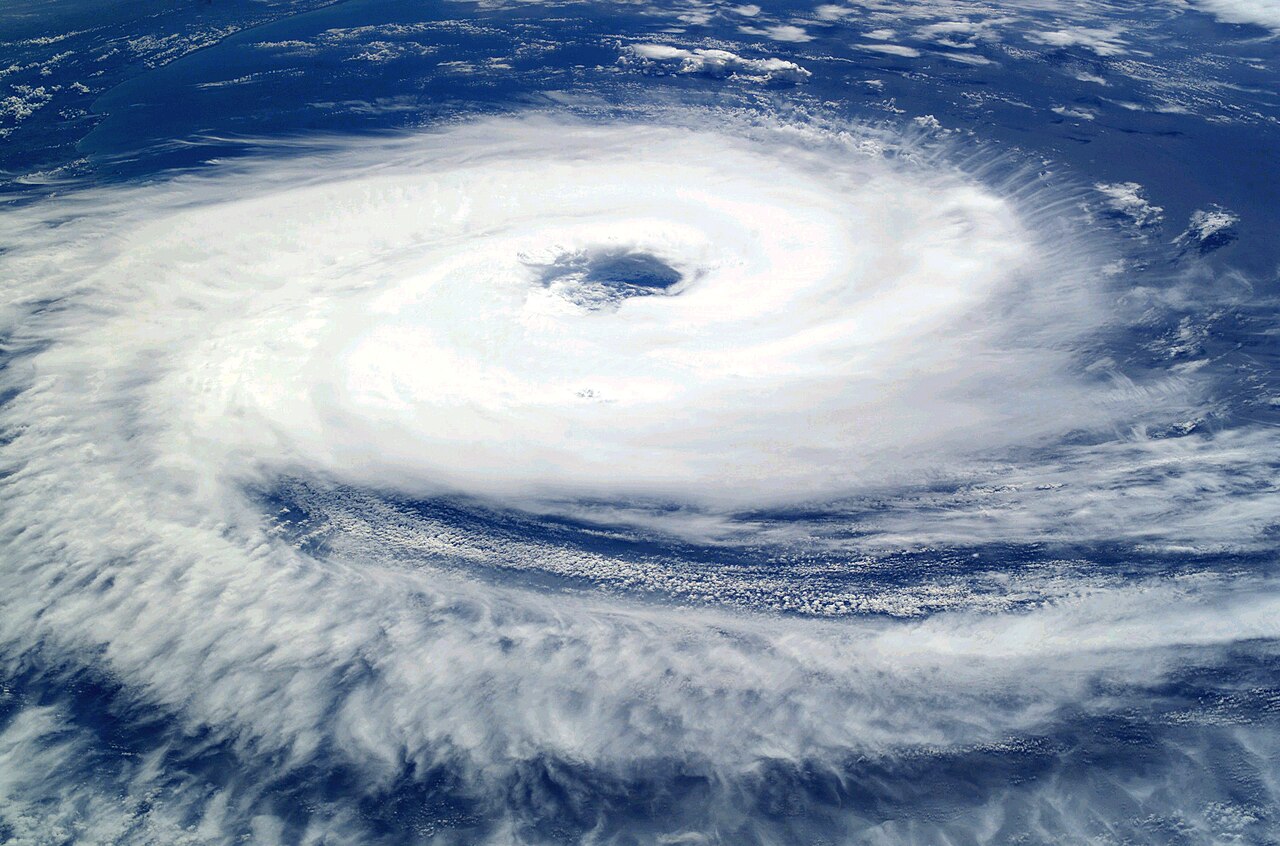
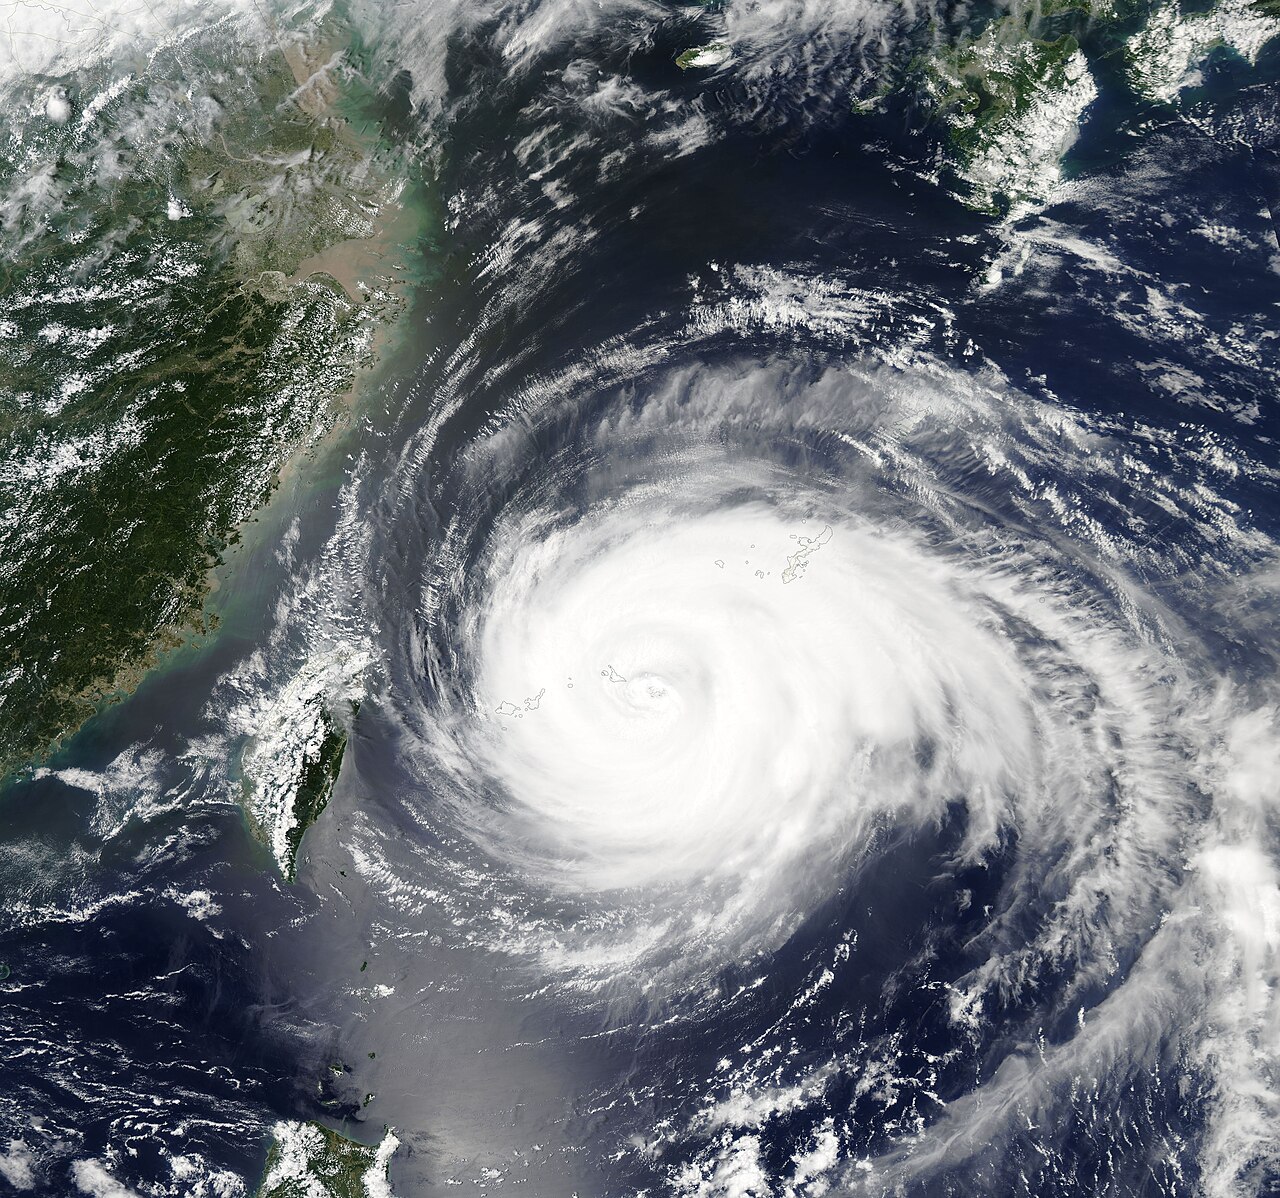
NASA / ISS astronaut photograph · Public domain · Wikimedia Commons · Source
The typhoon as a heat engine: idealizing the Carnot cycle
In 1986 and 1991, MIT meteorologist Kerry Emanuel described the radial circulation of a mature typhoon as a Carnot heat-engine cycle. This is an idealized model. It does not mean a typhoon is literally a mechanical engine. But it provides a powerful framework for understanding the energy flow.
A Carnot heat engine needs a hot reservoir and a cold reservoir. The typhoon’s hot reservoir is the warm sea surface (about 28°C, 301 K), and its cold reservoir is the outflow altitude of the upper troposphere (about −50 to −70°C, near 15–18 km altitude). The temperature difference between the two is the fundamental driving force of the typhoon. The “work” is the wind.
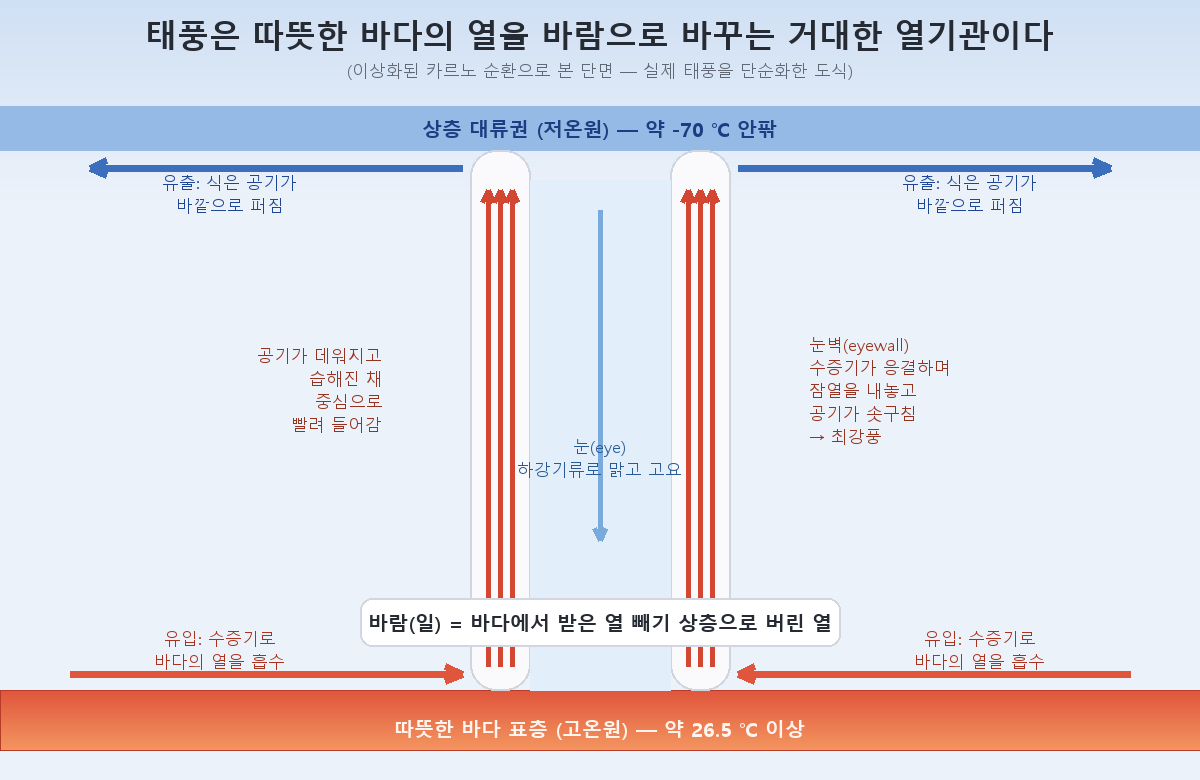
Diagram · created by glu.kr
This circulation can be idealized in four stages. First, air spirals inward through the sea-surface boundary layer, soaking up the ocean’s latent and sensible heat. Second, the air rises adiabatically in the eyewall. Third, near the upper troposphere the warm air flows outward and sheds heat by radiative cooling. Fourth, it descends far away and closes the cycle.
The idealized Carnot efficiency is given by η = (Ts − Tout) / Ts. Substituting a hot reservoir Ts ≈ 301 K and a cold reservoir Tout ≈ 200–223 K yields a maximum of about 0.35, that is, roughly 1/3. But this is an idealized upper bound. In a real typhoon, where irreversible heat transfer (frictional dissipation and the irreversible movement of sensible and latent heat) is at work, the efficiency is about 40% lower than this.
WISHE: a positive feedback loop
The development and maintenance of a typhoon rely on a key feedback mechanism called WISHE (Wind-Induced Surface Heat Exchange). Proposed by Emanuel in 1986, it works as follows. Stronger surface winds → greater sea-surface evaporation and sensible-heat flux → more energy supplied to the atmosphere → stronger convection → still stronger winds: a positive feedback loop. Emanuel explained that a typhoon’s intensity depends more on this sea-surface enthalpy flux than on atmospheric convective instability (CAPE).
Why it needs a warm sea, and why it dies over land
Because a typhoon is a heat engine that uses the warm sea as its hot reservoir, it decays as soon as that energy source disappears. When a typhoon makes landfall, two things happen at once. Sea-surface evaporation is cut off, severing the energy supply, and surface friction increases. The same happens over cold seas. When the sea surface temperature (SST) falls, the enthalpy difference between sea and air shrinks and the WISHE feedback weakens. On top of that, a typhoon itself mixes the seawater vertically and lowers the surface temperature — a self-suppressing mechanism.
The figure widely used as the minimum SST needed for a typhoon to form is 26.5°C. But this is a rule of thumb, not an absolute threshold. McTaggart-Cowan et al. (BAMS, 2015) confirmed cases where typhoons formed over waters below 26.5°C, and conversely, even well above 26.5°C a typhoon will not develop if vertical wind shear is strong or the air is dry. This number is just one of the necessary approximate conditions.
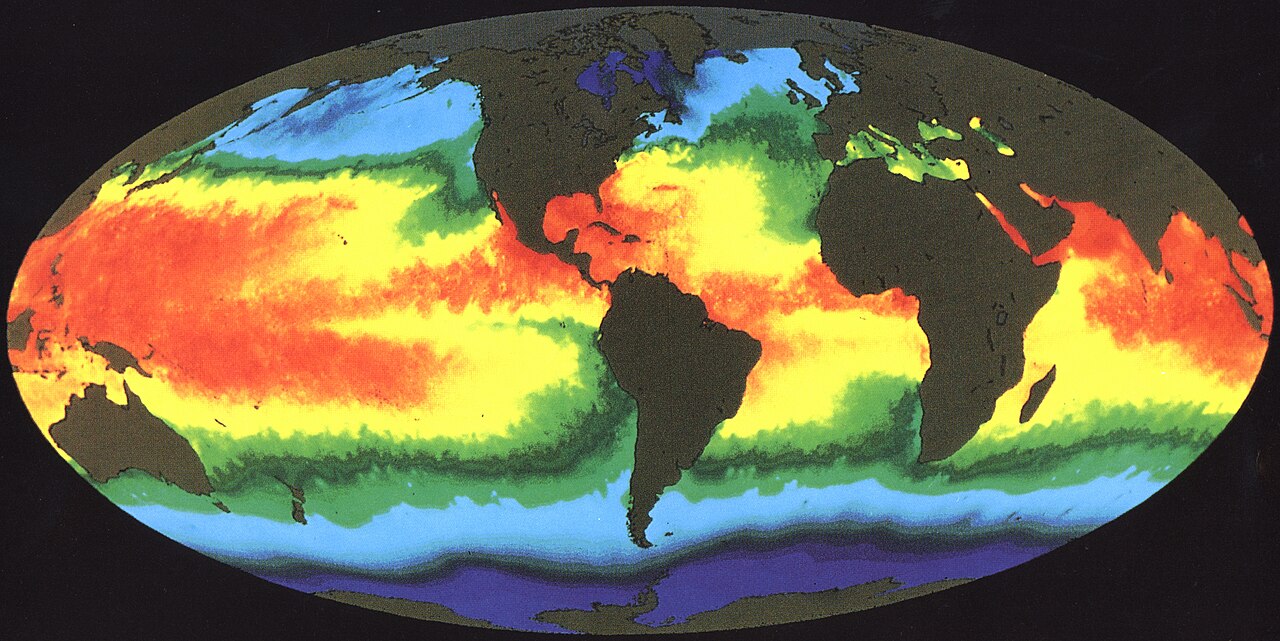
NASA · Public domain · Wikimedia Commons · Source
The theoretical ceiling: maximum potential intensity (MPI)
For a given SST and upper-air temperature profile, the heat-engine model yields the theoretical maximum wind speed a typhoon can reach — the maximum potential intensity (MPI). A representative MPI value reaches about 80 m/s (290 km/h). But real typhoons rarely reach this ceiling. Of all lifetime maximum intensities, only 1–9% reach 90% or more of the MPI, and a typical typhoon’s central-pressure drop comes to only about 55% of the MPI prediction. Vertical wind shear, dry-air intrusion, and ocean cooling all keep a typhoon from reaching its MPI.
The structure of a typhoon: eye, eyewall, spiral rainbands
As a heat engine, a typhoon’s structure divides into three elements: the eye, the eyewall, and the spiral rainbands.
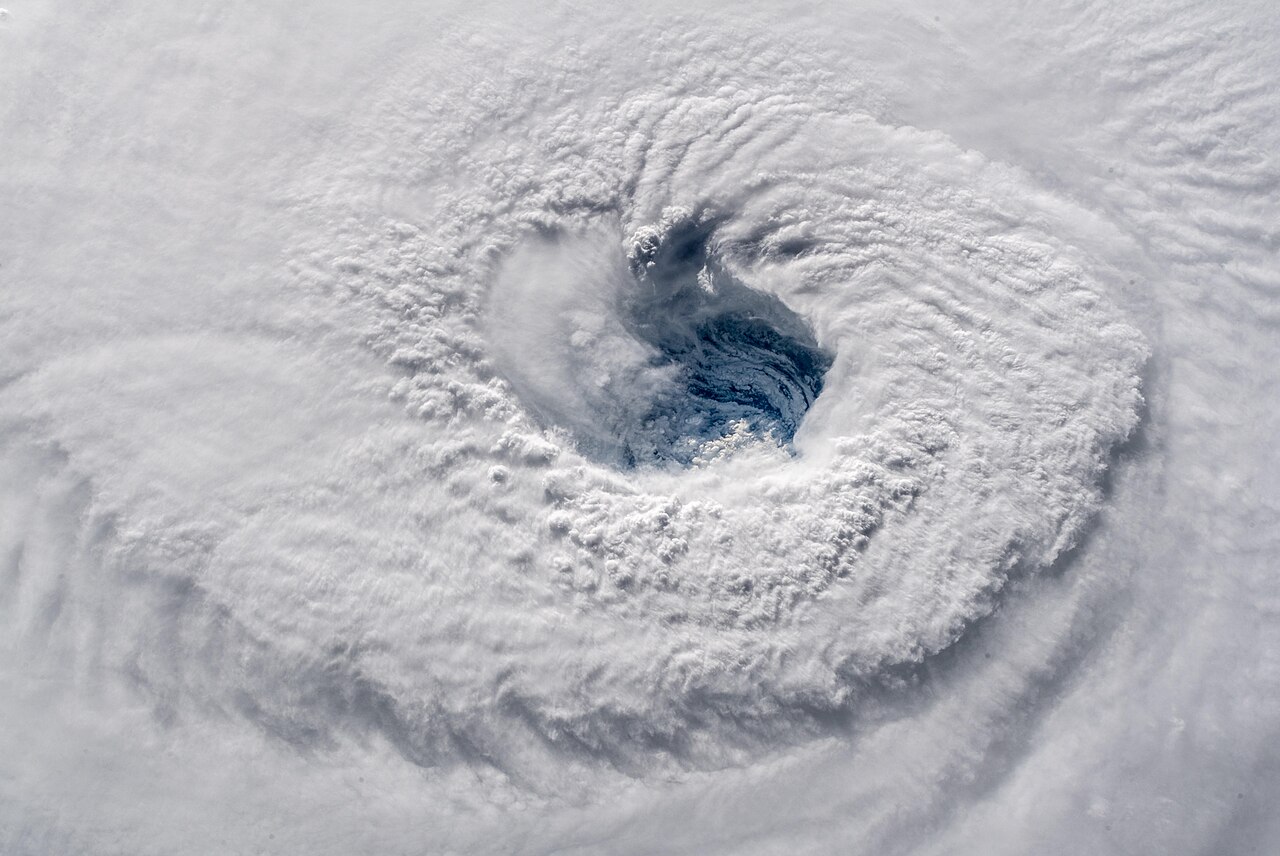
Alexander Gerst (ESA/NASA) · Public domain · Wikimedia Commons · Source
Why the eye is calm: subsidence
A typhoon’s eye is usually about 30–65 km across, and inside it is astonishingly calm. Wind speeds drop to 24 km/h or below, and the clouds may clear to reveal blue sky. The cause of this calm is subsidence (sinking air). Eyewall convection draws inner upper-level air downward, creating a weak descending current inside the eye; the sinking air is warmed and dried by adiabatic compression and dissipates the clouds. Through this process the eye’s center forms a warm-core structure about 5–10°C warmer than its surroundings (the maximum occurring in the mid-troposphere).
The important point is that the calm of the eye does not at all mean the whole typhoon is weak. The strongest winds are concentrated instead in the eyewall that encircles the eye. The eyewall is a ring of tall thunderstorms — the zone where the heaviest rain and strongest winds of the entire typhoon appear. In a strong typhoon, the eyewall clouds tilt outward as they rise, producing a “stadium effect” that looks like peering down into a stadium from above.
Formation conditions: the Coriolis force and the equatorial exclusion
Six conditions are needed for a typhoon to form: a sufficiently warm sea surface (SST near ≥ 26.5°C, maintained to a depth of 50 m or more), a sufficient Coriolis force, low vertical wind shear, atmospheric instability, a moist lower-to-mid atmosphere, and a pre-existing low-pressure disturbance. Of these, the Coriolis-force condition is decisive.
The Coriolis force varies with latitude and is exactly zero at the equator. Air converging toward a low-pressure center needs the Coriolis force in order to be deflected into a vortex. That is why typhoons almost never form within ±5° of the equator. There the deflection is too small for a rotating typhoon structure to take shape. That Typhoon Vamei formed at 1.5°N in 2001 and went on record is an extremely exceptional event in meteorological history.
NASA GSFC / MODIS · Public domain · Wikimedia Commons · Source
Just how large is the energy
According to NOAA’s Hurricane Research Division (AOML), an average hurricane or typhoon releases about 6.0 × 10¹⁴ W of latent (condensation) heat energy per day. That is about 200 times the world’s electricity-generating capacity. Of this, the kinetic energy of the wind is about 1.5 × 10¹² W, so the ratio of latent heat to wind energy is about 400:1. Most of the released energy does not become wind but is dissipated in convective updrafts and the upper-level cold exhaust. This dovetails exactly with the fact that the heat engine’s efficiency does not even reach 1/3.
The second face: rainfall and water supply
The typhoon’s second face is its role as a water supplier that coexists with disaster. This role is less well known than the disaster, but in East Asia and on the Korean Peninsula it is a reality that cannot be ignored.
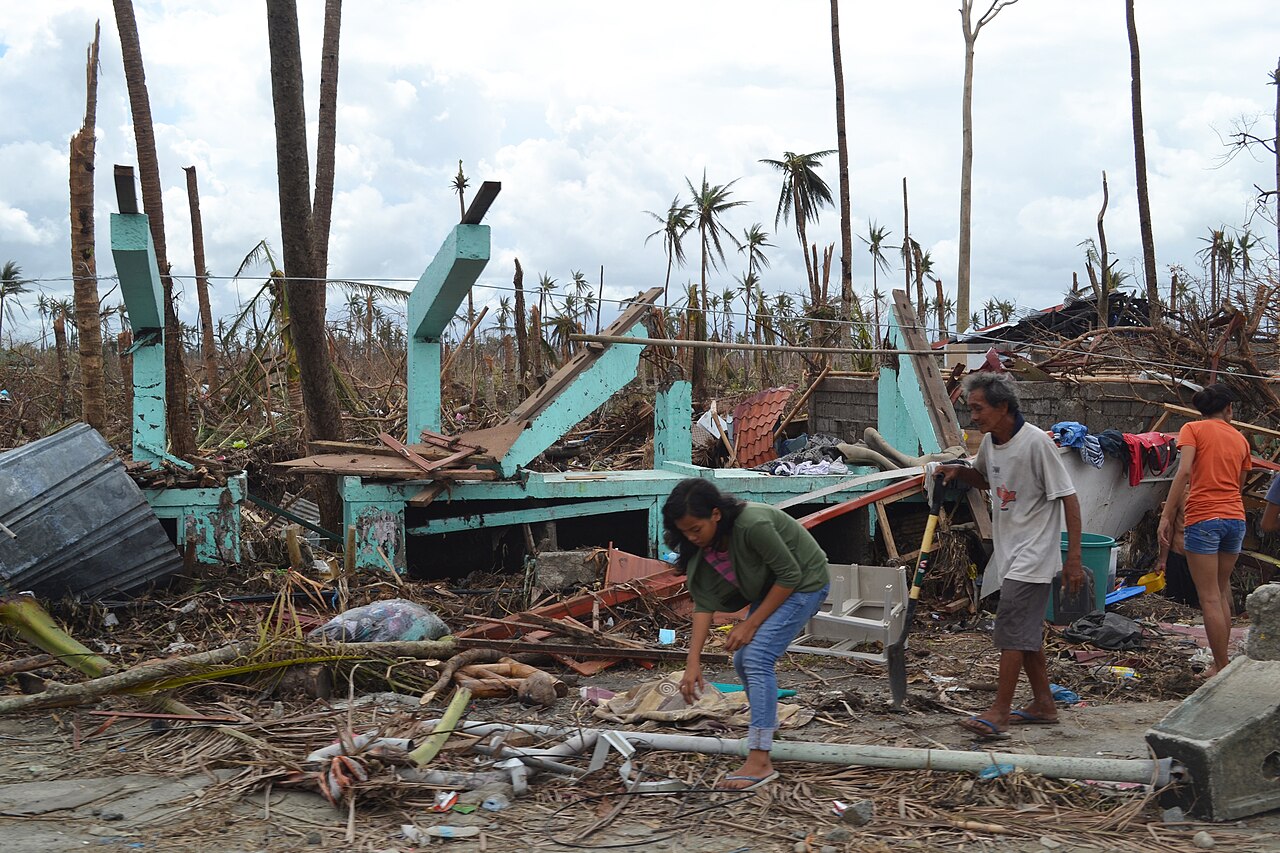
Trócaire · CC BY 2.0 · Wikimedia Commons · Source
Yoo et al. (2015, Geophysical Research Letters) applied a hidden Markov model to 40 years of Korean weather data from 1974 to 2013 and obtained a quantitative result. During the typhoon season (July–September), 43–90% of the severe drought events that occurred in South Korea’s coastal regions were ended by typhoon rainfall. The flip side of this statistic is that in years when typhoons do not come, southern Korea becomes vulnerable to water-shortage crises.
About 70% of the annual inflow to the Korean Peninsula’s major reservoirs occurs from June to September, when the changma (summer monsoon front) and typhoons are concentrated. According to Korea Meteorological Administration data (the 1991–2020 normals), summer (June–August) precipitation of 892.1 mm is about 63% of the annual total. Across the world’s tropics as a whole, some analyses attribute 8–17% of tropical annual rainfall to tropical cyclones (Nature Reviews Earth & Environment, 2026).
That said, typhoon rainfall is concentrated in a short time. In 2002, Typhoon Rusa dumped 870.5 mm in a single day on Gangneung. That is about 62% of Gangneung’s annual average rainfall. It can fill reservoirs, but it can also simply run off as a flood. The face of water supply and the face of flood disaster coexist within the same event.
Contribution to global heat redistribution: a matter of scientific debate
There is also a claim that typhoons help regulate Earth’s temperature by transporting tropical heat toward the poles. Emanuel (2001, J. Geophys. Res.) proposed that typhoon-induced ocean mixing could contribute to poleward ocean heat transport, and Sriver & Huber (2007, Nature) presented observational evidence that about 15% of the peak poleward ocean heat transport could be associated with typhoon mixing. But these estimates carry very large uncertainties, and later studies have raised objections. This is currently a subject of debate in the scientific community, and it is more accurate to confine it to a “proposed role.” The main agents of atmospheric heat transport are not typhoons but the mid-latitude baroclinic eddies (weather systems) and the general atmospheric circulation.
The Korean Peninsula and typhoons
On average about 3.4 typhoons (1991–2020) affect the Korean Peninsula each year, most often in August (1.2 on average), followed by July (1.0) and September (0.8). The two months of July and August account for about 66% of all typhoons that strike.
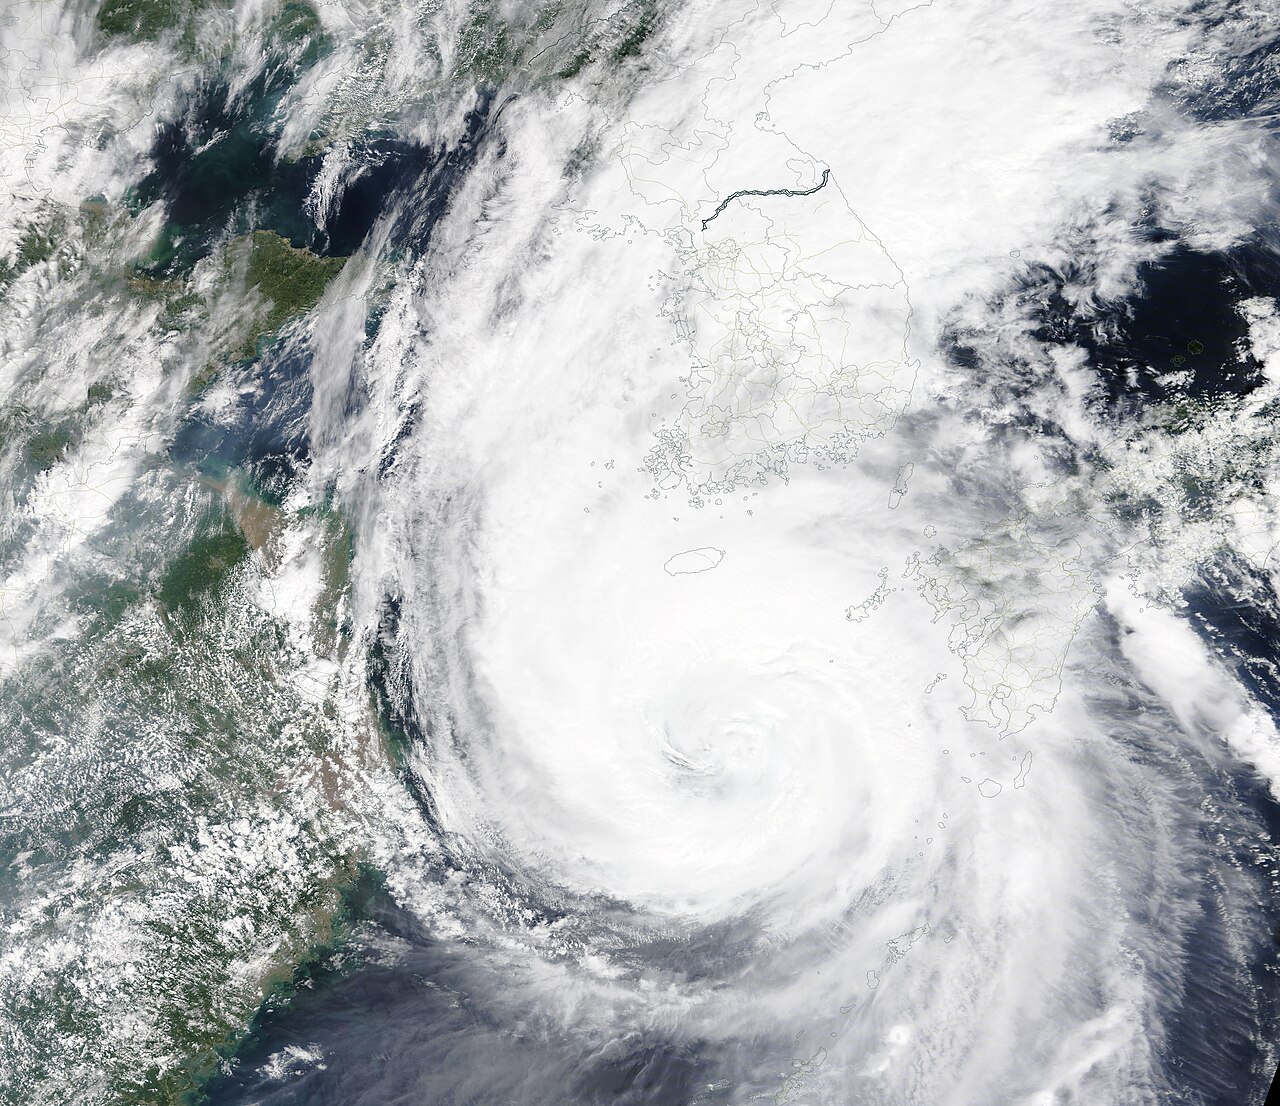
NASA GSFC / MODIS · Public domain · Wikimedia Commons · Source
The Korea Meteorological Administration classifies typhoons into four grades by the maximum wind speed near the center: normal (25–33 m/s), strong (33–44 m/s), very strong (44–54 m/s), and super strong (54 m/s and above, newly added in May 2020). In 2022, Typhoon Hinnamnor recorded a central pressure ranked among the strongest on record (around 955 hPa near landfall) and caused massive flooding damage at sites such as the POSCO steelworks in Pohang. It also dropped an extreme 948 mm of rain on Jeju Island over three days.
Two mechanisms make typhoon tracks curve toward the Korean Peninsula. One is beta drift, in which the latitudinal variation of the Coriolis parameter makes the typhoon itself drift west and north; the other is the steering flow, in which, as the western Pacific subtropical high (WPSH) retreats eastward, the steering winds turn the typhoon toward Japan and the Korean Peninsula.
What a typhoon reveals
A typhoon shows that many truths can coexist within a single phenomenon. The wind that flattens houses is at the same time a heat engine obeying precise laws of thermodynamics, and the rain that relieves drought at the same time causes floods. What is a disaster to humans is, from the viewpoint of the Earth system, a mechanism that moves energy and moisture.
It can be born only outside ±5° of the equator; it is a Carnot-style engine that takes the warm sea near 26.5°C as its hot reservoir and the cold air of the upper troposphere as its cold reservoir — a structure that blazes most fiercely at the eyewall yet is strangely calm at its very center. A typhoon, too, is a product of the physical laws embedded within the created world.
References
- Kerry Emanuel, MIT — Physics of Mature Tropical Cyclones (Carnot engine & WISHE)
- NOAA AOML Hurricane FAQ D7: How much energy does a hurricane release?
- NOAA AOML Hurricane Research Division FAQ (structure · eye · eyewall · subsidence)
- Practical Meteorology (Stull) Ch.16: Tropical Cyclone Thermodynamics — LibreTexts
- Maximum Potential Intensity — Wikipedia (Emanuel 1986 heat-engine theory)
- McTaggart-Cowan et al. (2015) — Revisiting the 26.5°C SST Threshold, BAMS
- Yoo et al. (2015) — Typhoons as Drought Busters in South Korea, Geophysical Research Letters
- NOAA JetStream — Tropical Cyclone Structure (eye · eyewall · subsidence)
- HKO Education — Why do tropical cyclones form more than 5° from the equator?
- Sriver & Huber (2007) — Observational evidence for an ocean heat pump induced by tropical cyclones, Nature
- Tropical cyclones and global precipitation — Nature Reviews Earth & Environment (2026)